Download præsentationen
Præsentation er lastning. Vent venligst

1
QA

2
Først indløbne spørgsmål Derefter er ordet frit Own laptops in the exam: Rules do not say anything about this, but specify printed aids and PC – so expect this is not permitted. Prepare for this.

3
Rules for the use of PCs at exams: http://www1.itu.dk/sw118342.asp#516_9214 2 http://www1.itu.dk/sw118342.asp#516_9214 2 Rules for DEDA exam specially: http://www1.itu.dk/graphics/ITU- library/Intranet/Uddannelse/Eksamen/PC- regler/Regler%20for%20brug%20af%20PC% 20ved%20eksamen%20i%20Experimental%2 0Design%20and%20Analysis.pdf http://www1.itu.dk/graphics/ITU- library/Intranet/Uddannelse/Eksamen/PC- regler/Regler%20for%20brug%20af%20PC% 20ved%20eksamen%20i%20Experimental%2 0Design%20and%20Analysis.pdf

4
Multiple choice sektionen: Der kan være flere svarmuligheder til spørgsmålene. Der kan være flere svarmuligheder på 0+ af spørgsmålene

5
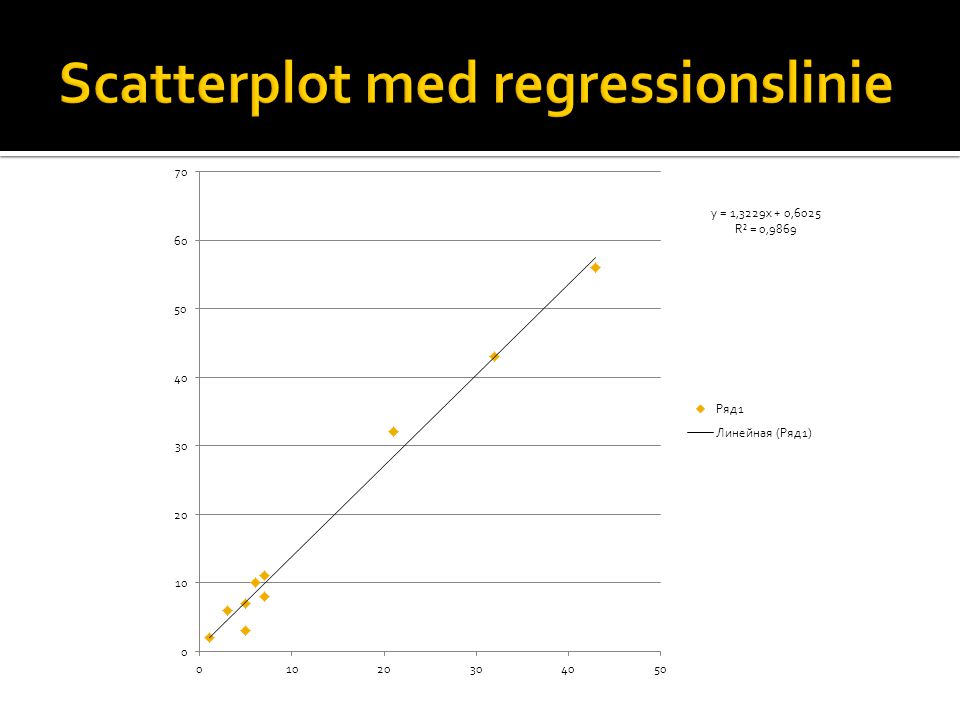
Q26 i eksamen: Gennemgang 26A) Work out the formula (algorithm) for the linear regression between the two variables. Løsning: enten beregne manuelt eller sæt data ind i SPSS

6
Using SPSS to obtain scatterplot with regression line: Analyze > Regression > Curve Estimation... ”constant" is the intercept with y- axis, "b1" is the slope”

7
Alle linear regressionformler har udseendet: Y = a + bx --- dvs: (med tallene beregnet i SPSS) Y = 0.602 + 1.322x 26B) Using your regression line formula, predict how many hours per week a person installing 50 games would spend playing them. Løsning: Sæt tallene ind i formlen. Hvis vi bruger ovenstående: Y = 0.602 + 1.322*50 Y = 66.702 timer

9
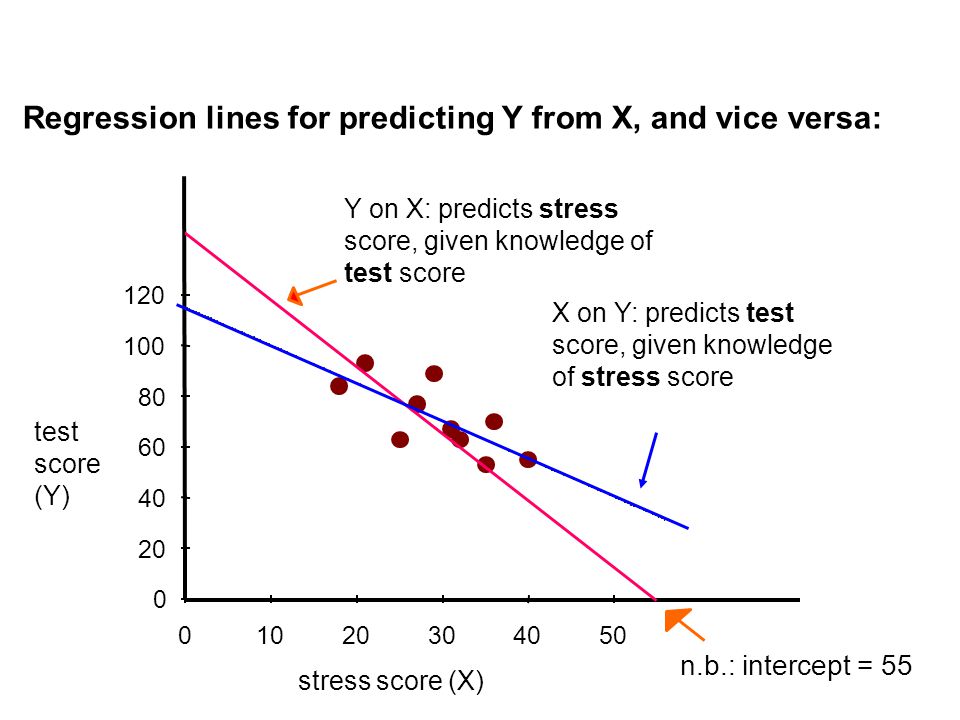
26C) Is the formula for the regression line the same if we put “number of games installed” on the Y-axis and “hours per week played” on the X-axis? Nej – husk at regression af X on Y ikke er det samme som regression af Y on X – der vil være en lille smule forskel

10
To predict Y from X requires a line that minimizes the deviations of the predicted Y's from actual Y's. To predict X from Y requires a line that minimizes the deviations of the predicted X's from actual X's - a different task (although somewhat similar)! Solution: To calculate regression of X on Y, swap the column labels (so that the "X" values are now the "Y" values, and vice versa); and re-do the calculations. So X is now test results, Y is now stress score
. Solution: To calculate regression of X on Y, swap the column labels (so that the X values are now the Y values, and vice versa); and re-do the calculations. So X is now test results, Y is now stress score.")
12
What is the difference between ordinal and interval data?? What kind of data are ratings? Ordinal data fortæller os ikke noget om distancen imellem to målinger. Vi ved at ”1” er før ”2” men ikke hvor meget afstanden faktisk er. I interval data er afstanden mellem målepunkterne konstant, men der er ikke et sandt nulpunkt Ratings – ratings er vist bare et udtryk. Kig på hvilke karakteristika måleenheden der bliver brugt har. F.eks. ”ratings on a scale from 0-50” – jamen så er det intervaldata.

13
Values are measureable Measuring size of variables is important for comparing results between studies/projects Different measures provide different quality of data: Nominal (categorical) data Ordinal data Interval data Ratio data Non-parametric Parametric
 data Ordinal data Interval data Ratio data Non-parametric Parametric")
14
Nominal data (categorical, frequency data) When numbers are used as names No relationship between the size of the number and what is being measured Two things with same number are equivalent Two things with different numbers are different
 When numbers are used as names No relationship between the size of the number and what is being measured Two things with same number are equivalent Two things with different numbers are different")
15
E.g. Numbers on the shirts of soccer players Nominal data are only used for frequencies How many times ”3” occurs in a sample How often player 3 scores compared to player 1

16
Ordinal data Provides information about the ordering of the data Does not tell us about the relative differences between values

17
For example: The order of people who complete a race – from the winner to the last to cross the finish line. Typical scale for questionnaire data

18
Interval data When measurements are made on a scale with equal intervals between points on the scale, but the scale has no true zero point.

19
Examples: Celsius temperature scale: 100 is water's boiling point; 0 is an arbitrary zero-point (when water freezes), not a true absence of temperature. Equal intervals represent equal amounts, but ratio statements are meaningless - e.g., 60 deg C is not twice as hot as 30 deg! -4 -3 -2 -1 0 1 2 3 4 1 2 3 4 5 6 7 8 9

20
Ratio data When measurements are made on a scale with equal intervals between points on the scale, and the scale has a true zero point. e.g. height, weight, time, distance. Measurements of relevance include: Reaction times, numbers correct answered, error scores in usability tests.

21
Q20B – is it a correlational study or between-groups design? Korrelation er en analysemetode. Mange typer eksperimentelle designs kan give ophav til en korrelationsanalyse. Eksperimentelle design er mere grundlæggende. I dette tilfælde er der tale om et between-groups (independent measures) eksperiment design – 3 grupper der måles hver for sig Bemærk: Ikke nødvendigvis et ”true” eksperiment – står ikke noget i opgaven om random allocation af participants
 eksperiment design – 3 grupper der måles hver for sig Bemærk: Ikke nødvendigvis et true eksperiment – står ikke noget i opgaven om random allocation af participants.")
22
Q21B – skal vi regne SD ud i hånden?? Hvilken SD regner SPSS ud? Den for populationen eller den for samplet? SD for sample: 8.644507; SD for population: 8.869077 – hvad siger SPSS? Note: Excel bruger SD for population (N-1)
.")
23
Q21C – er det +/- 1 SD? (Vel ikke +/- en halv SD?) +/- 1 SD – når man siger ”within x SD of the mean” betyder det + eller – Fordi data er normalfordelte ville vi forvente at 68% af de 20 scores lå indenfor en SD i begge retninger
 +/- 1 SD – når man siger within x SD of the mean betyder det + eller – Fordi data er normalfordelte ville vi forvente at 68% af de 20 scores lå indenfor en SD i begge retninger.")
24
Relationship between the normal curve and the standard deviation: All normal curves share this property: the SD cuts off a constant proportion of the distribution of scores:- -3 -2 -1 mean +1 +2 +3 Number of standard deviations either side of mean frequency 99.7%68%95%

25
About 68% of scores will fall in the range of the mean plus and minus 1 SD; 95% in the range of the mean +/- 2 SD's; 99.7% in the range of the mean +/- 3 SD's.

26
Q22C – skal 998 tillægges datasættet, nu hvor det ikke kan udelades? Fejl i opgaven: 998 findes ikke i talrækken. Ideen var at observere hvordan mean, median, mode og SD ændrer sig forskelligt når scores ændrer sig, dvs. hvorvidt mean, median eller mode er mest ”sårbare”. Der vil ikke være fejl i eksamenssættet.

27
Q25 – hvorfor er der 6 values fra hver by, når du skriver at der burde være noget andet? &%¤&¤... Host host... Nja der burde så stå ”six” i opgaveteksten, ikke ”seven” – det er en fejl. Hvis det her skulle opstå, så brug ALTID de rå data. Løs opgaven med de data I bliver givet. Som sagt: Eksamenssættet er grundigt tjekket.

28
Hvornår bruger vi z- scores?

29
Using z-scores, we can represent a given score in terms of how different it is from the mean of the group of scores. X i = 64 μ = 63 How to calculate z-score: Going beyond the data: Z-scores SD = 2 - SD from the mean

30
We can do the same thing to calculate the relationship of a sample mean to the population mean: (1) we obtain a particular sample mean; (2) we can represent this in terms of how different it is from the mean of its parent population. μ = 63 64

31
We use z-scores whenever we want to evaluate how far from a sample mean a score is E.g. to evaluate if a score is an outlier Hvis f.eks. en score er -1 SD fra mean, så ved vi at den falder indenfor de 68% hyppigste scores (grundet normalfordelingen i dataene) – dvs. ikke statistisk signifikant ved p<0.05 Or, conversely, how far away from the population mean our sample mean is
 – dvs. ikke statistisk signifikant ved p<0.05 Or, conversely, how far away from the population mean our sample mean is.")
32
Hvordan finder man ud af om scores i et datasæt er normalfordelt?

33
Parametric statistics work on the mean -> All data must be interval or ratio level data Parametric tests also make assumptions about the variance between groups or conditions So we must BOTH have parametric measure AND scores must adhere to the requirements of parametric statistics

34
For independent-measures (between groups), we assume that variance in one condition is the same as the other: Homogeneity of variance The spread of scores in each sample should be roughly similar Tested using Levene´s test (we do this in SPSS – often i gives you Levene´s test when running e.g. T-test) For repeated-measures (within subjects), we operate with the sphericity assumption, Tested using Mauchly´s test Basically the same thing: homogeneity of variance
 For repeated-measures (within subjects), we operate with the sphericity assumption, Tested using Mauchly´s test Basically the same thing: homogeneity of variance.")
35
SPSS output (independent measures t-test) t is calculated by dividing difference in means with standard error: 4.58/0.84359 Row 1 left show result of Levene´s test – tests the hypothesis that variance in the two samples is equal. If Levene´s test is significant at p<0.05 the assumption of homogenity of variance in the samples has been violated (this is annoying). If not, we assume equal variance (use row 1) Sig. is < than.05, so there is a significant difference between alcohol/no alcohol on performance
. If not, we assume equal variance (use row 1) Sig. is < than.05, so there is a significant difference between alcohol/no alcohol on performance.")
36
We also assume our data come from a population with a normal distribution We can test how much a distribution is similar to the normal distribution using the Kolmogorov-Smirnov test (the vodka test) and the Shapiro-Wilk tests The tests compare the set of scores in the sample to a normally distributed set of scores with the same mean and standard deviation If the test is non-significant (p>0.05) the distribution of the sample is NOT significantly different from a normal distribution (i.e. it is normal) [OPPOSITE OF LEVENE´S TEST!] If p<0.05, the distribution of the sample is significantly different from normal (e.g. positively or negatively skewed).
 [OPPOSITE OF LEVENE´S TEST!] If p<0.05, the distribution of the sample is significantly different from normal (e.g. positively or negatively skewed)..")
37
We can run Kolmogorov-Smirnov and Shapiro-Wilk tests in SPSS The most important is the Kolmogorov-Smirnov Test (K-S- test) SPSS produces an output that includes the test statistic itself (D), the degrees of freedom (df) (= the sample size) and the significance value of the test (sig.). If the significance of the K-S-test is less than.05, the distribution deviates significantly from the normal

38
Brush-up on standard deviation from the mean SD from the mean is just how many SD´s your score/result deviates from the mean value of the sample/population

Lignende præsentationer


>")


>")


