Download præsentationen
Præsentation er lastning. Vent venligst

1
21-11-2014 1 CRT’S ARBEJDE MED REGIONALE DATA OG MODELLER – EN PLATFORM FOR ANALYSESAMARBEJDE Bjarne Madsen Af Bjarne Madsen

2
2 4 plancher Hvordan arbejder vi? Hvem er brugerne – nu og i fremtiden ? Hvad er SAM-K og LINE? Forskning i regional udvikling – et eksempel

3
Teknisk PC-platform til overvågning af den lokale og regionale udvikling Danmarks Statistik forskerplaceringsordning Analysemedarbejdere I regioner, beskæftigelsesregioner mv. Center for Regional- og Turismeforskning Danmarks Statistiks Rå-/Mikrodata Konfiguration af SAM-K and LINE Universiteter og andre forskn.inst.

4
Teknisk PC-platform til overvågning af den lokale og regionale udvikling Danmarks Statistik forskerplaceringsordning Analysemedarbejdere I regioner, Beskæftigelsesregioner mv. Center for Regional- og Turismeforskning Danmarks Statistiks Rå-/Mikrodata Konfiguration af SAM-K and LINE Universiteter og andre forskn.inst. 12 brugere 20 bruger PC’er Fælles PC 1 PC 8 PC’er

5
21-11-2014 5 I dag: –5 regioner –4 beskæftigelsesregioner –Erhvervs- og Byggestyrelsen (EBST) –Bornholms Regionskommune (færgetrafikundersøgelsen, Bornholms barometer) –Ringkøbing-Skjern kommune –VisitDenmark –SDU (IFG / CFL / Kolding) –Københavns Universitet Hvem er brugerne?
 –Bornholms Regionskommune (færgetrafikundersøgelsen, Bornholms barometer) –Ringkøbing-Skjern kommune –VisitDenmark –SDU (IFG / CFL / Kolding) –Københavns Universitet Hvem er brugerne")
6
21-11-2014 6 I fremtiden: –Kommunerne – og KL??? –Videnskabsministeriet, Undervisningsministeriet, Velfærdsministeriet mv. –Universiteterne Bornholm som case og eksperimentarium: –Færgeundersøgelse & Bornholms barometer –Bornholms Regionskommune som case – budget, befolkningsfremskrivning, arbejdsmarked og uddannelse mv. –AKTUALISERING (HVAD SKER DER NU ?) Hvem er brugerne?
 Hvem er brugerne .")
7
21-11-2014 7 Registerdata = Danmarks Statistiks rådata SAM-K = Social Accounting Matrix for LINE = Lokal Interregional Ekonomisk model Hvad er SAM-K og LINE?

8
21-11-2014 8 Registerdata = Danmarks Statistiks rådata –Personregisterdata 5.3 mio. records for 1994-2007 –Produktionregisterdata 0,3 mio. records for 1998-2007 –Aktualiserede data DREAM-data E-indkomst-data Moms-data Hvad er registerdata?

9
21-11-2014 9 SAM-K = Social Accounting Matrix for Kommuner = Udvidede nationalregnskaber for kommuner –Produktion fordelt på erhverv –Befolkning, arbejdsstyrke, beskæftigelse og arbejdsløshed –Primærindkomst, skatter, indkomstoverførsler, disponibel indkomster –Efterspørgsel – eksport. Import, turisme, moms, vareskatter Hvad er SAM-K og LINE

10
21-11-2014 10 LINE = Lokal Interregional Ekonomisk analysemodel = ADAM for kommuner –Fremskrivninger af produktion, indkomst, beskæftigelse, arbejdsløshed mv. (Basisfremskrivning / Krisescenario) –Konsekvensberegninger (turismens betydning, nedlæggelse af arbejdspladser, trafikanlæg, miljøkonsekvenser mv.) Hvad er SAM-K og LINE?
 –Konsekvensberegninger (turismens betydning, nedlæggelse af arbejdspladser, trafikanlæg, miljøkonsekvenser mv.) Hvad er SAM-K og LINE .")
11
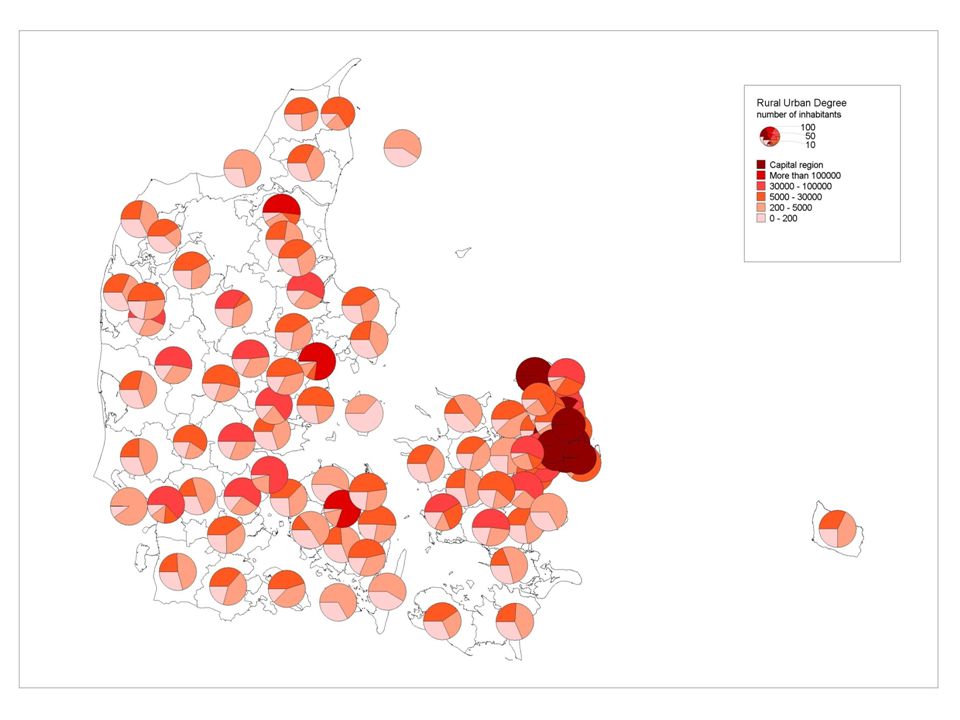
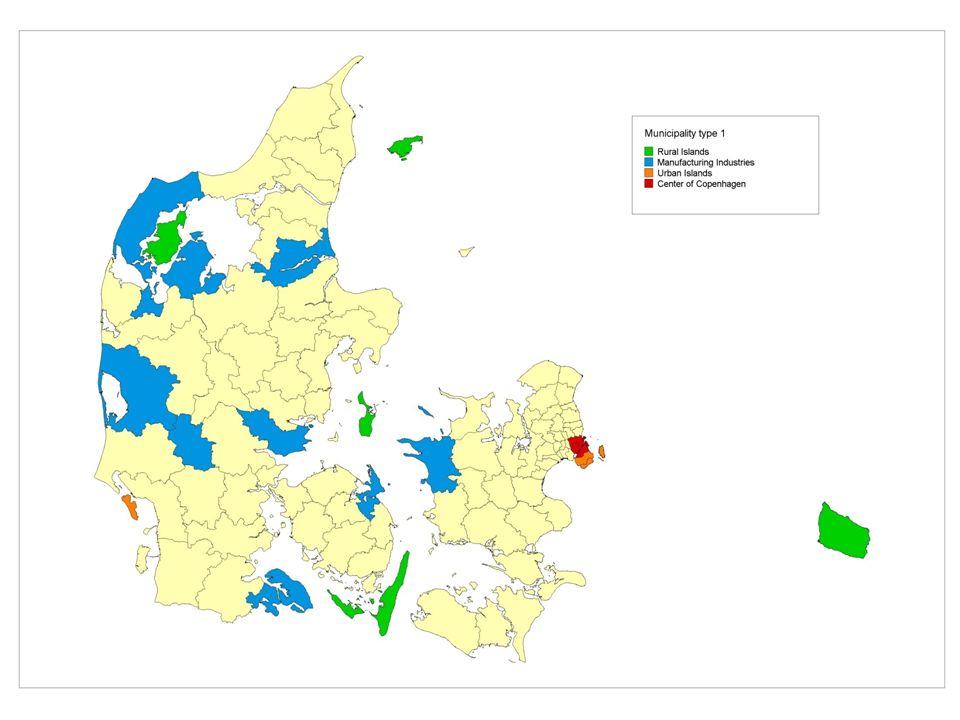
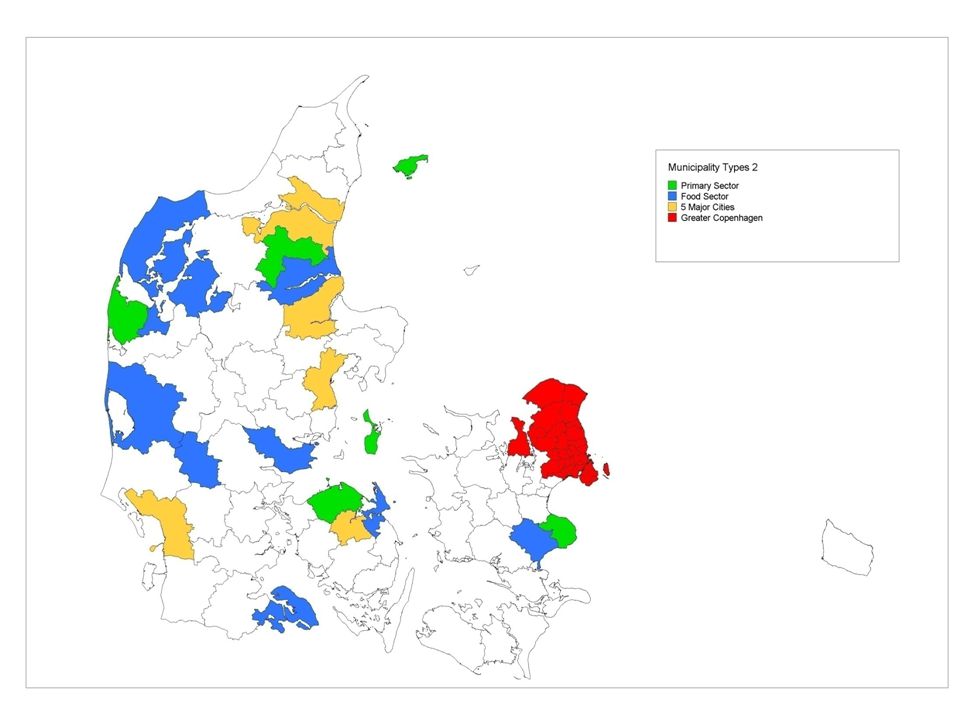
21-11-2014 11 1 kort –Andel af befolkning i landområder ares 6 tables –Rækker: Kommunetype –Søjler: Land / by Forskning i regional udvikling: Øer og udkanstsområder – et par eksempler

12
21-11-2014 12
13
21-11-2014 13 Type of municipality HovedstadenMere end 100.000 indb. 30000 - 100000 indb. 5000 - 30000 indb. 200 - 5000 indb. 0 - 200 indb.I alt Bornholm 0,0 32,242,625,1100,0 Øer i udkantsområd er 0,0 25,041,733,3100,0 Øer ved store byer 70,30,0 20,28,11,4100,0 Alle øer 26,40,0 23,229,121,3100,0 Landbrugsko mmuner 0,0 13,249,537,2100,0 Fødevarekom muner 0,0 3,930,537,927,6100,0 Industrikomm uner 0,0 38,935,225,8100,0 5 store byer 0,053,914,46,518,56,6100,0 Københavns centrum 100,00,0 100,0 Hovedstadsre gionen 66,60,06,817,36,32,9100,0 Hele landet 20,08,814,319,323,414,1100,0 Fordelingen af befolkningen på by-/landområde og kommunetype

14
21-11-2014 14
15
21-11-2014 15
16
21-11-2014 16 Type of municipality Capital region More than 100.000 inhab. 30000 - 100000 inhab. 5000 - 30000 inhab. 200 - 5000 inhab. 0 - 200 inhab.Total Bornholm 0,0 32,242,625,1100,0 Rural islands 0,0 25,041,733,3100,0 Urban islands 70,30,0 20,28,11,4100,0 Islands 26,40,0 23,229,121,3100,0 Primary sector 0,0 13,249,537,2100,0 Food sectors 0,0 3,930,537,927,6100,0 Manufacturing Industry 0,0 38,935,225,8100,0 5 major cities 0,053,914,46,518,56,6100,0 Copenhagen Centre 100,00,0 100,0 Greater Copenhagen 66,60,06,817,36,32,9100,0 Denmark 20,08,814,319,323,414,1100,0 Share of Population by Rurality / Urbanicity and by Type of Municipality in 2005

17
21-11-2014 17 Type of municipality Capital region More than 100.000 inhab. 30000 - 100000 inhab. 5000 - 30000 inhab. 200 - 5000 inhab. 0 - 200 inhab.Total Bornholm 0,0 32,242,625,1100,0 Rural islands 0,0 25,041,733,3100,0 Urban islands 70,30,0 20,28,11,4100,0 Islands 26,40,0 23,229,121,3100,0 Primary sector 0,0 13,249,537,2100,0 Food sectors 0,0 3,930,537,927,6100,0 Manufacturing Industry 0,0 38,935,225,8100,0 5 major cities 0,053,914,46,518,56,6100,0 Copenhagen Centre 100,00,0 100,0 Greater Copenhagen 66,60,06,817,36,32,9100,0 Denmark 20,08,814,319,323,414,1100,0 Share of Population by Rurality / Urbanicity and by Type of Municipality in 2005

18
21-11-2014 18 Type of municipality Capital region More than 100.000 inhab. 30000 - 100000 inhab. 5000 - 30000 inhab. 200 - 5000 inhab. 0 - 200 inhab.Total Bornholm 0,0 32,242,625,1100,0 Rural islands 0,0 25,041,733,3100,0 Urban islands 70,30,0 20,28,11,4100,0 Islands 26,40,0 23,229,121,3100,0 Primary sector 0,0 13,249,537,2100,0 Food sectors 0,0 3,930,537,927,6100,0 Manufacturing Industry 0,0 38,935,225,8100,0 5 major cities 0,053,914,46,518,56,6100,0 Copenhagen Centre 100,00,0 100,0 Greater Copenhagen 66,60,06,817,36,32,9100,0 Denmark 20,08,814,319,323,414,1100,0 Share of Population by Rurality / Urbanicity and by Type of Municipality in 2005

19
21-11-2014 19 Type of municipality Capital region More than 100.000 inhab. 30000 - 100000 inhab. 5000 - 30000 inhab. 200 - 5000 inhab. 0 - 200 inhab.Total Bornholm 0,0 32,239,128,60,0 Rural islands 0,0 24,838,536,60,0 Urban islands 70,20,0 19,88,41,570,2 Islands 28,50,0 22,826,322,428,5 Primary sector 0,0 13,147,439,40,0 Food sectors 0,0 4,129,236,530,10,0 Manufacturing Industry 0,0 37,634,128,30,0 5 major cities 0,053,714,06,418,57,30,0 Copenhagen Centre 100,00,0 100,0 Greater Copenhagen 66,90,06,617,16,23,266,9 Denmark 20,58,714,218,622,815,220,5 Share of Residential Employment by Rurality / Urbanicity and by Type of Municipality in 2005

20
21-11-2014 20 Type of municipality Capital region More than 100.000 inhab. 30000 - 100000 inhab. 5000 - 30000 inhab. 200 - 5000 inhab. 0 - 200 inhab.Total Bornholm ---6,98,76,27,4 Rural islands ---5,77,55,46,3 Urban islands 3,8--2,33,33,23,5 Islands 3,8--4,57,05,35,2 Primary sector 18,2-3,33,73,93,8 Food sectors 3,211,52,54,53,63,23,7 Manufacturing Industry 13,813,04,93,62,92,53,1 5 major cities 7,55,33,65,03,73,44,7 Copenhagen Centre 4,318,27,57,14,50,04,3 Greater Copenhagen 4,09,13,63,03,33,13,7 Denmark 4,05,33,53,93,43,13,8 Unemployment Rate by Rurality / Urbanicity and by Type of Municipality in 2005

21
21-11-2014 21 Type of municipality Capital region More than 100.000 inhab. 30000 - 100000 inhab. 5000 - 30000 inhab. 200 - 5000 inhab. 0 - 200 inhab.Total Bornholm ---6,98,76,27,4 Rural islands ---5,77,55,46,3 Urban islands 3,8--2,33,33,23,5 Islands 3,8--4,57,05,35,2 Primary sector 18,2-3,33,73,93,8 Food sectors 3,211,52,54,53,63,23,7 Manufacturing Industry 13,813,04,93,62,92,53,1 5 major cities 7,55,33,65,03,73,44,7 Copenhagen Centre 4,318,27,57,14,50,04,3 Greater Copenhagen 4,09,13,63,03,33,13,7 Denmark 4,05,33,53,93,43,13,8 Unemployment Rate by Rurality / Urbanicity and by Type of Municipality in 2005

22
21-11-2014 22 Type of municipality Capital region More than 100.000 inhab. 30000 - 100000 inhab. 5000 - 30000 inhab. 200 - 5000 inhab. 0 - 200 inhab.Total Bornholm ---6,98,76,27,4 Rural islands ---5,77,55,46,3 Urban islands 3,8--2,33,33,23,5 Islands 3,8--4,57,05,35,2 Primary sector 18,2-3,33,73,93,8 Food sectors 3,211,52,54,53,63,23,7 Manufacturing Industry 13,813,04,93,62,92,53,1 5 major cities 7,55,33,65,03,73,44,7 Copenhagen Centre 4,318,27,57,14,50,04,3 Greater Copenhagen 4,09,13,63,03,33,13,7 Denmark 4,05,33,53,93,43,13,8 Unemployment Rate by Rurality / Urbanicity and by Type of Municipality in 2005

23
21-11-2014 23 Type of municipality Capital region More than 100.000 inhab. 30000 - 100000 inhab. 5000 - 30000 inhab. 200 - 5000 inhab. 0 - 200 inhab.Total Bornholm ---6,98,76,27,4 Rural islands ---5,77,55,46,3 Urban islands 3,8--2,33,33,23,5 Islands 3,8--4,57,05,35,2 Primary sector 18,2-3,33,73,93,8 Food sectors 3,211,52,54,53,63,23,7 Manufacturing Industry 13,813,04,93,62,92,53,1 5 major cities 7,55,33,65,03,73,44,7 Copenhagen Centre 4,318,27,57,14,50,04,3 Greater Copenhagen 4,09,13,63,03,33,13,7 Denmark 4,05,33,53,93,43,13,8 Unemployment Rate by Rurality / Urbanicity and by Type of Municipality in 2005

24
21-11-2014 24 Type of municipality Capital region More than 100.000 inhab. 30000 - 100000 inhab. 5000 - 30000 inhab. 200 - 5000 inhab. 0 - 200 inhab.Total Bornholm ---6,98,76,27,4 Rural islands ---5,77,55,46,3 Urban islands 3,8--2,33,33,23,5 Islands 3,8--4,57,05,35,2 Primary sector 18,2-3,33,73,93,8 Food sectors 3,211,52,54,53,63,23,7 Manufacturing Industry 13,813,04,93,62,92,53,1 5 major cities 7,55,33,65,03,73,44,7 Copenhagen Centre 4,318,27,57,14,50,04,3 Greater Copenhagen 4,09,13,63,03,33,13,7 Denmark 4,05,33,53,93,43,13,8 Unemployment Rate by Rurality / Urbanicity and by Type of Municipality in 2005

25
21-11-2014 25 Type of municipality Capital region More than 100.000 inhab. 30000 - 100000 inhab. 5000 - 30000 inhab. 200 - 5000 inhab. 0 - 200 inhab.Total Bornholm 71,433,3100,048,245,254,748,5 Rural islands 69,250,0100,048,145,753,048,7 Urban islands 54,00,071,452,355,757,953,5 Islands 54,046,281,849,546,853,250,5 Primary sector 73,360,925,052,751,156,653,3 Food sectors 75,947,953,750,750,456,852,3 Manufacturing Industry 54,750,967,250,750,557,052,1 5 major cities 63,952,750,651,952,057,252,4 Copenhagen Centre 56,139,346,048,361,157,155,9 Greater Copenhagen 54,140,052,052,752,857,553,6 Denmark 54,252,752,351,051,356,852,7 Labor Force Participation Rate by Rurality / Urbanicity and by Type of Municipality in 2005

26
21-11-2014 26 Type of municipality Capital region More than 100.000 inhab. 30000 - 100000 inhab. 5000 - 30000 inhab. 200 - 5000 inhab. 0 - 200 inhab.Total Bornholm ---116.93098.852109.741107.298 Rural islands 4.864--117.012100.706107.170106.608 Urban islands 166.228--198.626171.808139.246171.514 Islands 166.174--143.630108.172107.952131.022 Primary sector 8.667--145.071135.190130.183134.201 Food sectors 5.5471.936140.264130.283125.565122.934126.514 Manufacturing Industry 5662.2031.168134.304130.068128.819130.835 5 major cities 5.477131.536130.730138.883146.488136.289134.558 Copenhagen Centre 147.1792.615---27.257146.482 Greater Copenhagen 158.6681.955175.204176.841167.362161.199162.846 Denmark 158.580131.378148.974146.629140.292134.322144.258 Primary Income per Inhabitant (DK-kr) by Rurality / Urbanicity and by Type of Municipality in 2005
 by Rurality / Urbanicity and by Type of Municipality in")
27
21-11-2014 27 Type of municipality Capital region More than 100.000 inhab. 30000 - 100000 inhab. 5000 - 30000 inhab. 200 - 5000 inhab. 0 - 200 inhab.Total Bornholm ---109,092,1102,3100,0 Rural islands 4,6--109,894,5100,5100,0 Urban islands 96,9--115,8100,281,2100,0 Islands 126,8--109,682,682,4100,0 Primary sector 6,5--108,1100,797,0100,0 Food sectors 4,41,5110,9103,099,397,2100,0 Manufacturing Industry 0,41,70,9102,799,498,5100,0 5 major cities 4,197,897,2103,2108,9101,3100,0 Copenhagen Centre 100,51,8---18,6100,0 Greater Copenhagen 97,41,2107,6108,6102,899,0 100,0 Denmark 109,991,1103,3101,697,393,1100,0 Primary Income per Inhabitant (DK-kr) by Rurality / Urbanicity and by Type of Municipality in 2005 - Index
 by Rurality / Urbanicity and by Type of Municipality in Index.")
28
21-11-2014 28 Type of municipality Capital region More than 100.000 inhab. 30000 - 100000 inhab. 5000 - 30000 inhab. 200 - 5000 inhab. 0 - 200 inhab.Total Bornholm ---260.398239.579213.988238.701 Rural islands 7.026--257.912238.309213.546233.808 Urban islands 320.306--389.141319.001248.306332.032 Islands 320.166--304.177248.805214.490273.671 Primary sector 14.445--284.751274.747239.208261.769 Food sectors 7.5474.574267.634269.059258.605223.386251.203 Manufacturing Industry 1.2004.9681.828274.681265.139231.794258.987 5 major cities 9.277263.796268.023281.503292.352246.551269.189 Copenhagen Centre 274.3678.137---47.700274.017 Greater Copenhagen 305.2125.377349.453346.174327.876289.192315.560 Denmark 305.014263.487294.992299.063282.872244.292284.230 Primary Income per Employed (DK-kr) by Rurality / Urbanicity and by Type of Municipality in 2005
 by Rurality / Urbanicity and by Type of Municipality in")
29
21-11-2014 29 Type of municipality Capital region More than 100.000 inhab. 30000 - 100000 inhab. 5000 - 30000 inhab. 200 - 5000 inhab. 0 - 200 inhab.Total Bornholm ---109,1100,489,6100,0 Rural islands 3,0--110,3101,991,3100,0 Urban islands 96,5--117,296,174,8100,0 Islands 117,0--111,190,978,4100,0 Primary sector 5,5--108,8105,091,4100,0 Food sectors 3,01,8106,5107,1102,988,9100,0 Manufacturing Industry 0,51,90,7106,1102,489,5100,0 5 major cities 3,498,099,6104,6108,691,6100,0 Copenhagen Centre 100,13,0---17,4100,0 Greater Copenhagen 96,71,7110,7109,7103,991,6100,0 Denmark 107,392,7103,8105,299,585,9100,0 Primary Income per Employed (DK-kr) by Rurality / Urbanicity and by Type of Municipality in 2005 - Index
 by Rurality / Urbanicity and by Type of Municipality in Index.")
Lignende præsentationer


 (Nyt program - 1. september) LifePak ® (eksempel) – 72,40 PSV 401,60 DKK med 5 % rabat= 381,52 DKK (68,78 PSV) Fragt.>")


>")


